O.R.E.O. Project 2013

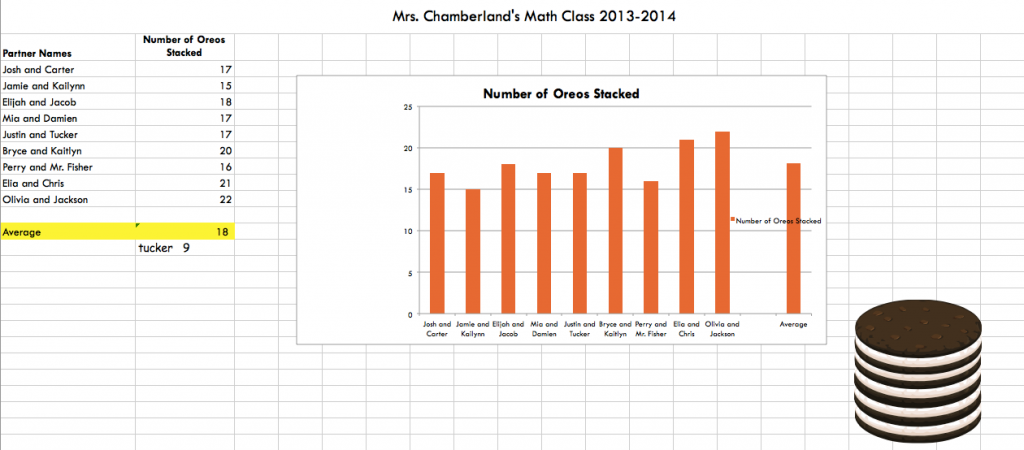
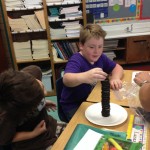
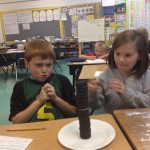
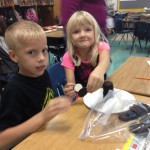
Mrs. Chamberland’s class participated in the great O.R.E.O. Project this year!  These second graders used their estimation, counting, and graphing skills during this project.  They submitted their results online, and compared the number of oreos they stacked with people all over the world!

Take a look at an example graph they made in Excel!
Oreo Chamberland 2013

Stacking Oreos! (and graphing them too)

OreosA few weeks ago, students at Oak Grove and Clearbrook went Oreo crazy!  They brought in packages of the yummy cookies and tried to stack the tallest towers.  But it wasn’t just for fun…it was part of a global project with students all over the world participating!  You can learn more about the Oreo Project on Jen Wagner’s website.  This was the 12th year of the project, and this time 15,501 students participated from 719 different classes. 


IMG_0803After stacking oreos, different grade levels participated in different activities with the oreos, from science to math to writing.  Many classes created Excel Spreadsheets showing the average cookie stack, or the mode, median, mean, and range of the stacks.  They even used excel formulas for their calculations!  


 A few examples of their spreadsheets are shown below!

Mrs. Beir’s Class (Clearbrook — 3rd Grade)

Mrs. Hushour’s Class (Clearbrook — 3rd Grade)

Mrs. Bralley’s Class (Oak Grove — 3rd Grade)


Mrs. Sharp’s Block 1 Class (Oak Grove — 5th Grade)


Mrs. Sharp’s Block 2 Class (Oak Grove — 5th Grade)


Mrs. Mortez’s Block 1 Class (Oak Grove –5th Grade)

Mrs. Mortez’s Block 2 Class (Oak Grove — 5th Grade)

Mrs. Grave’s Class (Clearbrook — 5th Grade)

Mrs. Hudson’s Class (Clearbrook — 5th Grade)

O.R.E.O.s

First Grade classes around the county participated in an O.R.E.O. project, including Mrs. Chapman’s class, Mrs. Williams’ class, Mrs. Braun’s class,  and all of Oak Grove’s First Grade!   It was tons of fun, and it all centered around cookies!!

Students stacked cookies to see how tall of a tower they could make before it tumbled and tallied their results. Then, they entered results on a spreadsheet to find a class average and to view a graph.  They discussed the data using words like greather than, less than, and equal to (see example below). 

Oreo Project Example

Oreo Project Example

Click here for a  blank version of the spreadsheet.

Finally, they entered their data into a project database that included data from across the United States, and even a few other countries! To view the project results (including a map of all the participants), click here!  Globally, the class average for stacks was 18 cookies!


Here’s a few pictures from the event:
O.R.E.O. Project 2009 on PhotoPeach

Oh…and just in case your wondering, we did NOT eat the ones we stacked! ;)